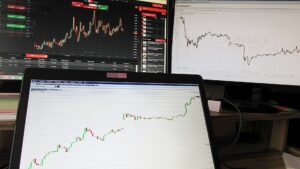
 MetaTrader 4 is probably still the most popular global trading platform. Not only because of its robust trade execution speed and comprehensive market visibility, but also because of its vast collection of trading indicators for efficient analysis of price trends. Whether you are a novice or a professional trader, MT4 offers standard as well as custom indicators for all your trading needs. Those custom indicators are written in the MQL4 programming language. Moreover, most of them are available for free. So, what are the best MetaTrader 4 indicators? Our choices are presented below. Let’s start.
MACD
The Moving Average Convergence Divergence (MACD) is a MT4 trend indicator. A trend-following momentum indicator to be precise. It demonstrates the relationship between two moving averages of prices. It is one of the best trend following indicators, widely used by intraday and swing traders. The 26-day Exponential Moving Average (EMA) is subtracted from the 12-day EMA, which is the faster moving average. A 9-day EMA acts as the signal line, triggering buy and sell signals. The 9-day EMA is the slower moving average line. The faster moving average line is quicker to react to price changes. When prices move, this MA line will move quickly and crossover the 9-day EMA line. When this crossover occurs and the faster line tends to “diverge” from the slower line, a new trend formation is indicated.
RSI
The Relative Strength Index (RSI) is a leading MetaTrader 4 indicator. It measures the ratio of upward price movement to downward price movement, and normalises the calculations to reflect trend strength in a range of 0 to 100. If the RSI is above 70, the market conditions are said to be overbought; that is prices have increased more than market expectations. If the RSI is below 30, it is considered a signal that the instrument is oversold, giving an indication that the prices might rise in the future. Traders usually consider this situation as a signal to buy. Readings of 70 and higher is considered an indication to sell.
Bollinger Bands
Bollinger Bands are volatility MetaTrader 4 indicators, used to identify key support and resistance levels. These bands or channels widen and contract, depending on the extent of volatility in the market. There are 3 lines that make up the volatility channel: the central Simple Moving Average (SMA) line with default value of 20, the lower band (two standard deviations lower than SMA) and the upper band (two standard deviations above SMA). In a highly volatile market, the bands tend to widen and contract subsequently (squeeze) with decreasing volatility. Traders usually place entry and exit points near these channels, rather than exactly on them. Sell orders are placed in the upper band limit and buy orders near the lower band limit.
Fibonacci Retracement
Fibonacci Retracement is an extremely versatile MetaTrader 4 indicator, used to identify potential support and resistance areas. The indicator works on the principle that when price moves hugely in one direction, it retraces back to the previous price level, before moving again in the original direction. Fibonacci Retracement is calculated by taking two peak points on a price chart and then dividing the vertical distance by the key Fibonacci ratios. Once these levels are established, horizontal lines are plotted to identify potential support and resistance levels.
On-Balance Volume
The On Balance Volume MetaTrader 4 indicator (OBV) is applied to gauge the positive and negative flow of volume in a security, in relation to its price over time. It is a simple measure that keeps a cumulative total of volume by either adding or subtracting each period’s volume, depending on the price movement. What is more, this measure expands on the basic volume measure by combining both price movement and volume. The logic behind this indicator is that volume precedes price movement, so if a security is seeing an increasing OBV, it is a signal that volume is growing on upward price movements. In turn, decreases mean that the security is seeing increasing volume on down days.
Stochastic Oscillator
Stochastic Oscillator is also a MetaTrader 4 indicator that serves to detect the momentum of the trend. However, it’s not one of the best MT4 indicators for this reason. Stochastic Oscillator enables traders to predict where the current trend will ultimately end up. It uses a scale from 0 to 100 to measure the rate at which the price has changed from the previous closing price of an asset. The scale is then applied to the Stochastic lines to determine if the market is overbought or oversold.
If the Stochastic lines are above 80, the indicator shows that the market is overbought, and according to the supply-demand law, the price has to go down in order for the market balance to restore. Therefore, the traders get the sell signal. Conversely, if the Stochastic lines are below 20, the indicator shows that the market is oversold, and the same economic law suggests that the price should increase to restore the balance. That’s why the indicator will give out the buy signal.
There is the third option, where the Stochastic lines are in between the two checkpoints. It says that:
- During the uptrend, the prices will likely remain above or at least equal to the previous closing price of the asset
- During the downtrend, the prices will likely remain lower or equal to the previous closing prices of the asset
Parabolic SAR
The Parabolic SAR is a MetaTrader 4 indicator used to identify trend reversal, which helps to interpret a bearish or bullish condition. It places dots and points on the chart, to indicate potential trend reversals. When the dots are below the candles, it is a signal to enter a long position and, conversely, when the dots are above the candles, it is a sell signal. This tool is best used in markets that are trending, and not in ranging markets. Additionally, the Parabolic SAR is one of the best MetaTrader 4 indicators to help decide when to close or open a trade. It is a leading indicator like RSI and Stochastic that gives a signal before a reversal or new trend occurs.
Money Flow Index (MFI)
The Money Flow Index (MFI) is a MetaTrader 4 momentum indicator that utilises an instrument’s price and volume in order to predict the reliability of the current trend. New traders aren’t quite familiar with it but this indicator surely can help traders identify areas of supply and demand. It looks into the price changes and tick volume on the charts, in order to ascertain whether money is flowing in or out of a trading asset. The time span of calculations is set by default at 14, and the values of MFI range from 0 to 100. If the value is lower than 20, the market is oversold, while a value of above 80 signals an overbought market.
Hammer/Hanging Man Indicator
Hammer and Hanging Man are candlestick-based patterns for identifying important reversal patterns. Hanging man is a bearish reversal pattern of one candlestick, generally found in the uptrend areas on price charts. The lower wick is much longer than the upper body and should be two times the size of the upper portion, in order for the pattern to be considered valid. Hammer, on the other hand, is a bullish reversal pattern, during market downtrends, signifying a potential trend reversal. This means that sellers were initially in control, but buyers reversed that trend to drive prices back up to near the high for the day.
ZigZag Indicator
The last of the Top 10 MetaTrader 4 indicators is ZigZag. It’s one of the most overlooked MetaTrader 4 indicators mainly due to its simplicity. However, even with its simplicity, the ZigZag Indicator is a crucial technical analysis tool that connects highs and lows. This helps identify trends as well as resistances and supports. Since highs and lows are controlled by buying and selling, the ZigZag indicator is characterized by high flexibility making it possible to indicate even the slightest market trends. Likewise, by identifying highs the indicator signals horizontal resistance and lows as horizontal supports.
How to install indicators on MetaTrader 4?
The indicators mentioned above are basic indicators, which should be available on every MetaTrader 4 platform. However, if you want to install custom indicators onto your trading platform, you need to follow these simple steps:
- Copy the custom indicator
- Open the data folder
- Open the MQL4 file
- Open the indicators file
- Paste the copied data
- Restart the MetaTrader 4 platform


