Yesterday, the American indices showed mixed sentiment. All three of them finished the session almost exactly at the same levels as they started. Today, they are still showing mixed sentiment and the volatility is rather low. What can they do next? Let’s try to answer that question in an analysis, S&P 500 first:
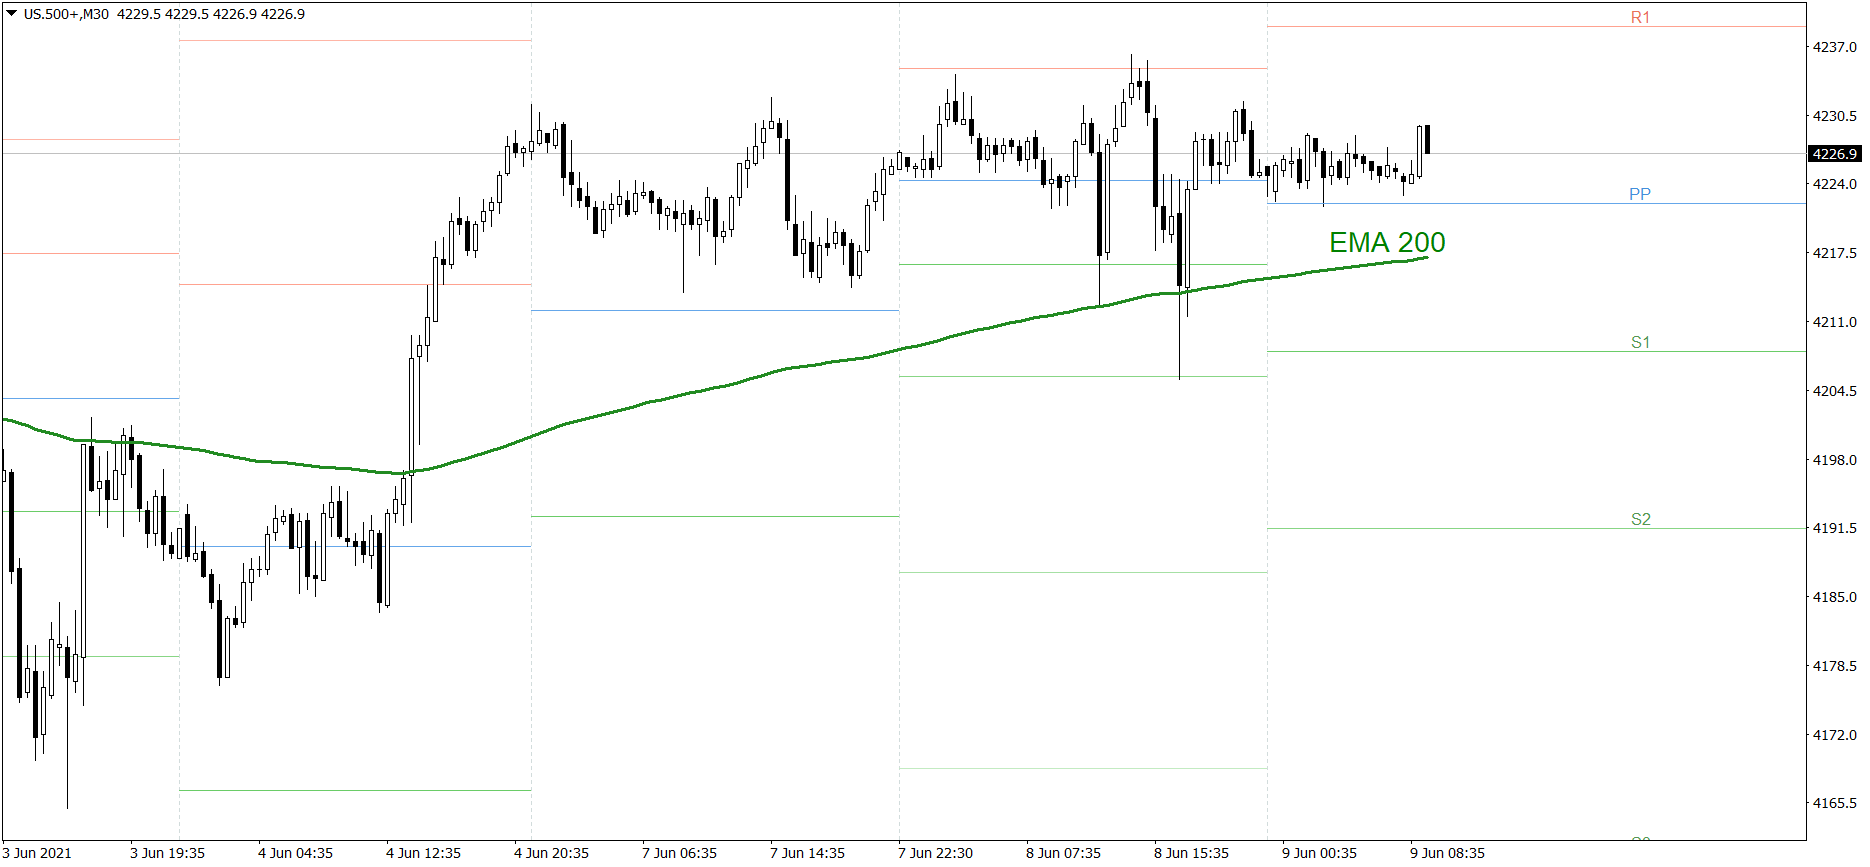
S&P 500
The S&P 500 showed mixed sentiment yesterday. The price tested the R1 resistance level, got really close to the all-time high, and two hours later dropped to the S2 support level. However, in the end it finished the session at the Pivot Point. Today, it is still showing mixed sentiment and the volatility is really low. If the buyers take control over the market, the price might rise to the R1 and set the new all-time high. But if the bears show their strength, the price could fall below the EMA 200.
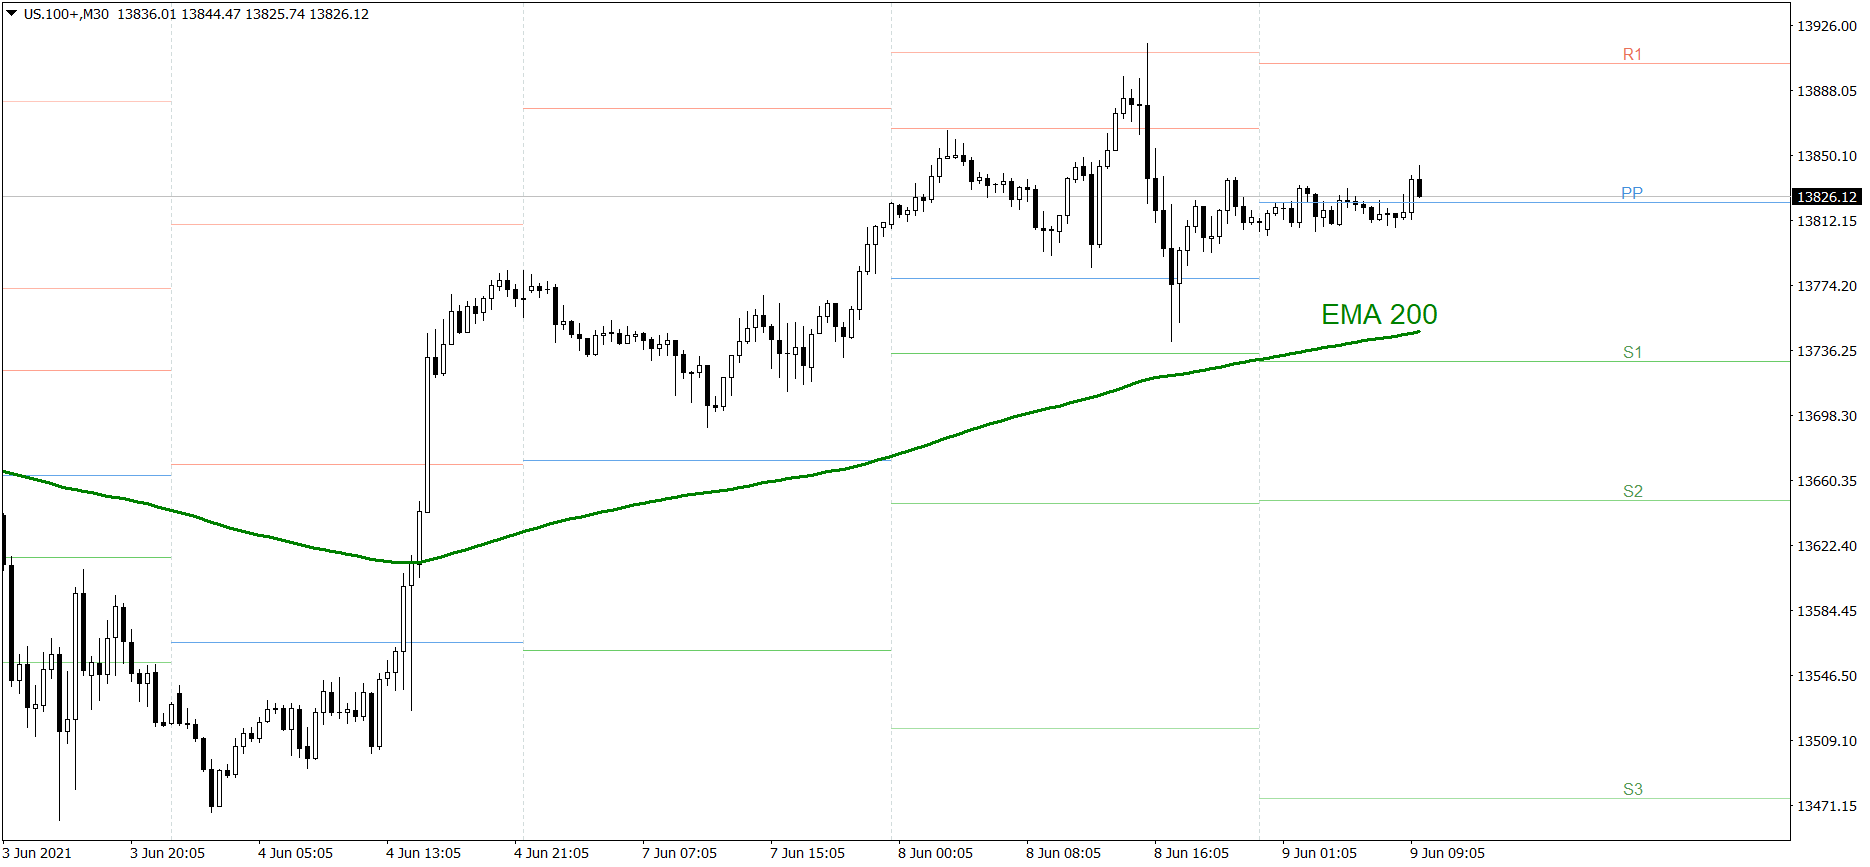
NASDAQ 100
NASDAQ 100 also showed mixed sentiment yesterday. The price rose above 13900 and tested the R2 resistance level, but in the end, it finished the session slightly above 13800. Today, it is still showing mixed sentiment and the volatility is really low. If the buyers take control over the market, the price might rise above the R1. But if the bears show their strength, the price could fall to the EMA 200.
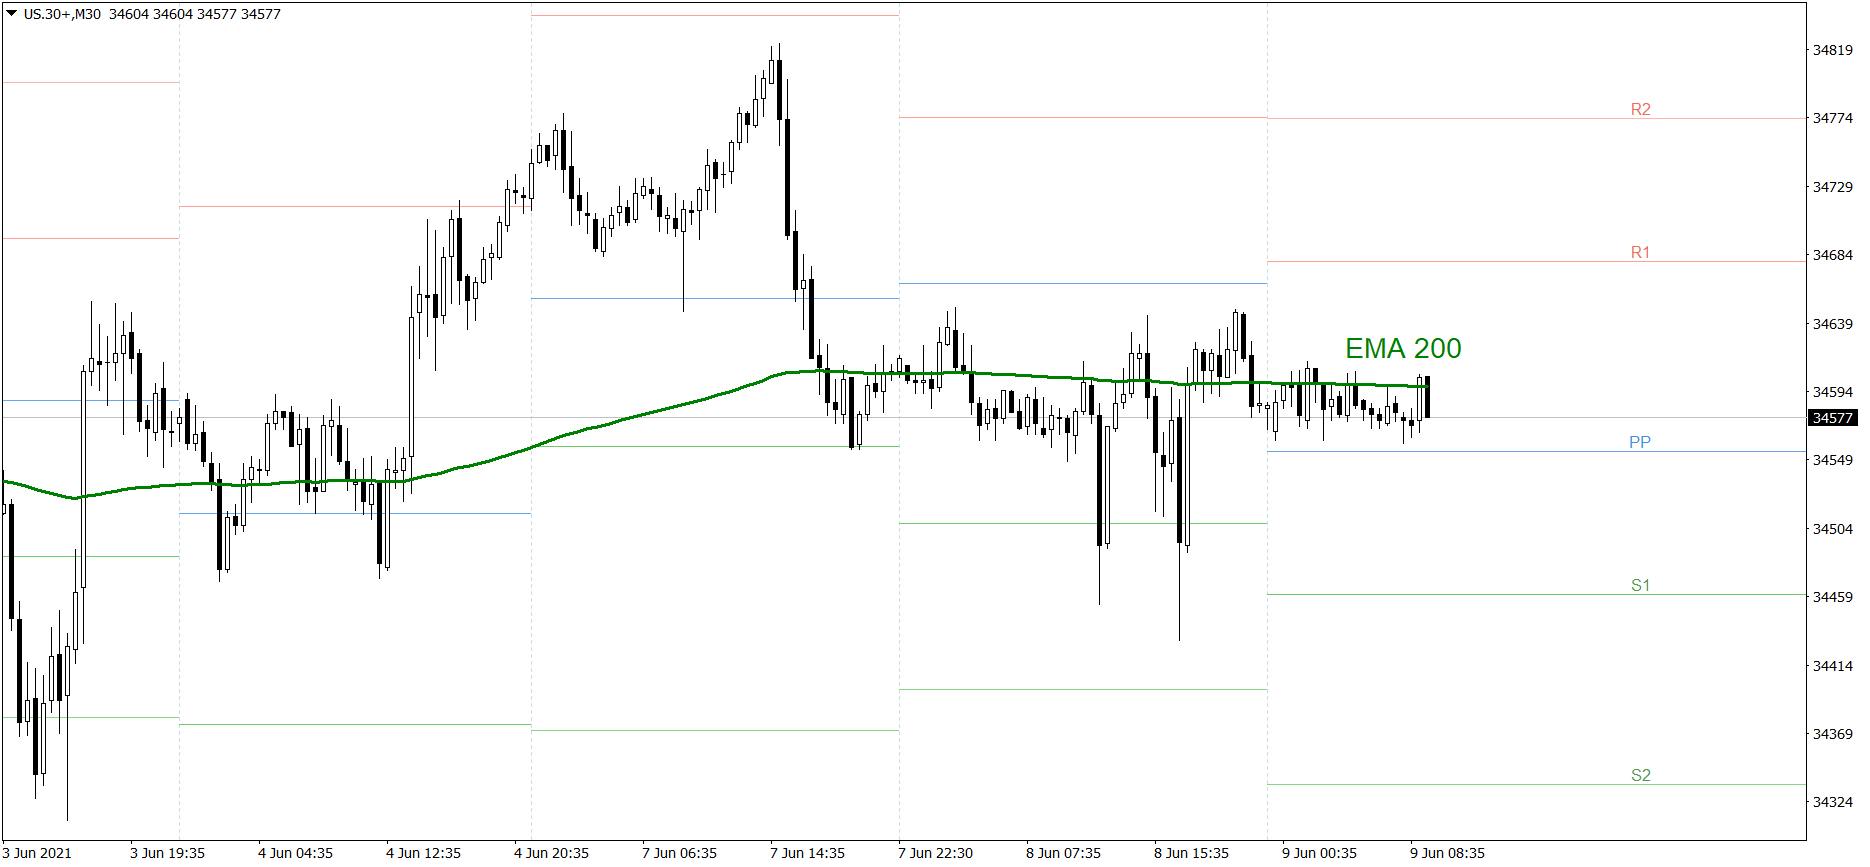
Dow Jones Industrial Average
The DJIA index showed mixed sentiment yesterday as well. The bears attacked the S1 support level twice, but they were too weak to make the price stay below that level. It finished the session slightly below the EMA 200. Today, it is still showing mixed sentiment and the volatility is really low. If the buyers take control over the market, the price might rise above the R1 resistance level. But if the bears show their strength, the price could fall to the S1.