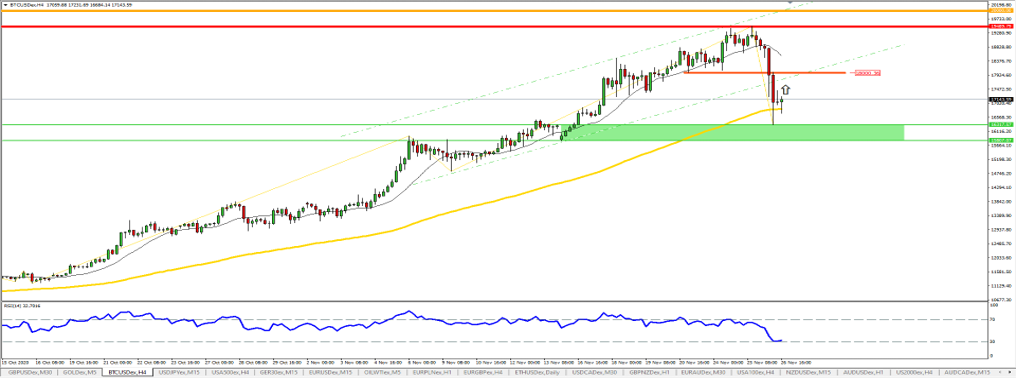
The flagship cryptocurrency topped a new multi-year high at $19 500 on November 25, having gained over 200% since the beginning of the year and nearly 500% since the mid-March market crash. However, since that market experienced a deep bearish correction which plunged the BTC price into $16 300 level. The sharp move implies that the deeper correction might have started and reached the final bears’ destination at $15 800 or low.
Similar developments were observed in 2017 at the height of the crypto craze when the Bitcoin was nearing the 20000 mark right before Christmas. This psychologically satisfying number compelled many investors to cash in on their accumulated profits, and have a very merry Christmas
Whales activity is another reliable indicator that allows an understanding of what’s going on behind the scenes. When large investors start moving and the number of Bitcoin whales dropped, the market usually looses increasing the selling pressure.
On the downside, we can observe correction movement into $ 18 000 level if the bears fail to keep up the pace. The 100D SMA yellow line can be great potential support where further declines may backstopped